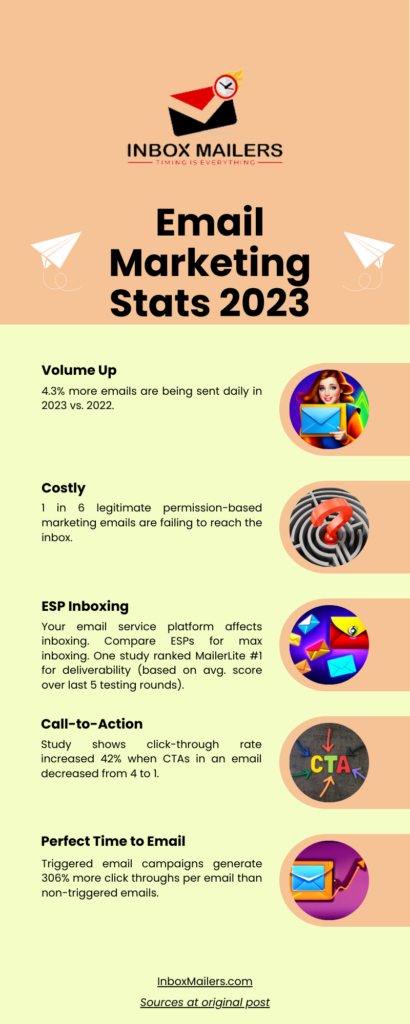
Below you’ll find a simple infographic outlining email marketing statistics (many freshly updated for 2023).
Open rates are always a key but are now murky thanks to a certain ‘fruit company’.🍎
Making click-through rates more telling than ever.
See what else is happening with email marketing statistics in 2023 below.

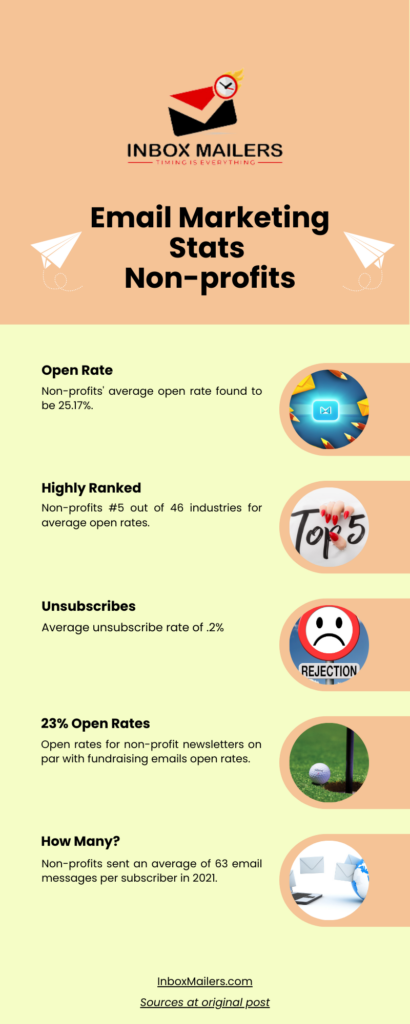
As a bonus, we gathered up email marketing stats that affect non-profits (average open rates + more).
Average Email Open Rates for Non-profits

It makes sense that non-profits see some of the highest average open rates. People care about causes so naturally, they want to stay informed.
One thing to note about that emotional attachment.
Non-profit email marketers must go above and beyond to get noticed in email inboxes too.
Why?
Inboxes are generally crowded but also, there are more causes to choose from than ever before.
So:
🌟Make sure your subject lines get attention
⭐Always produce top-notch content
🌟Pay attention to design trends that can make your email campaigns memorable
⭐Use Inbox Mailers’ Network Effect to boost open rates to 50% – 70% (Free One-on-One Demo)
Email Marketing Stats and Facts are Constantly Evolving.
With many factors affecting open rates, click rates, bounces, and so on.
It’s vital to watch your own email stats as well as broad benchmarks. Then there are industry-by-industry statistics to track too.
Does this sound like a tremendous amount of statistics to track? Yes, but with inboxes being filled to the brim, knowing what’s working and what isn’t gives you an inboxing advantage.
Please share the above infographics with your team and other marketers who could use a little help improving their email marketing statistics in 2023 and beyond.


